XR Entertainment Project Cost and ROI Analysis
XR Entertainment Project Cost and ROI Analysis: Build the Model Around Real Throughput
XR entertainment project cost and ROI analysis should be built around real throughput, not brochure capacity. This is the difference between a serious investment model and a sales spreadsheet. In 2026, cultural tourism groups, shopping mall owners, and FEC operators are looking at XR attractions because they can create paid experiences in controlled indoor spaces. But ROI depends on project format, location traffic, ticket price, staffing, operating cycle, and content refresh.
A Flying Theater, XR Infinite Space, Hyper XR Theater, Dark Ride, and Holographic Museum can all be profitable in the right setting. They can also miss expectations when the cost model ignores daily operation.
Start With the Full Project Cost
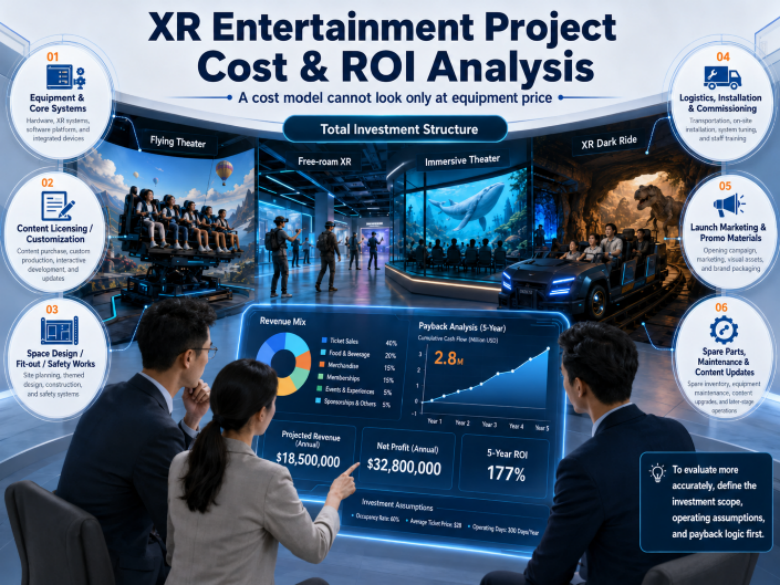
The first number should be total project investment, not the equipment price. A proper cost model includes:
- Equipment and core systems.
- Content license or custom content production.
- Space design, decoration, and safety work.
- Freight, installation, commissioning, and training.
- Launch marketing and media materials.
- Spare parts, maintenance, and future content updates.
For example, Flying Theater project investment cost may include a motion platform, dome or screen system, projection or LED display, audio, special effects, film content, show control, and civil installation conditions. XR Infinite Space cost is more affected by playable area, headset quantity, tracking, multiplayer software, and game content. Dark Ride cost adds route design, vehicles, scenes, lighting, interaction systems, and show control.
If these formats are compared by “equipment price” only, the analysis is already distorted.
Throughput Is the Core ROI Variable
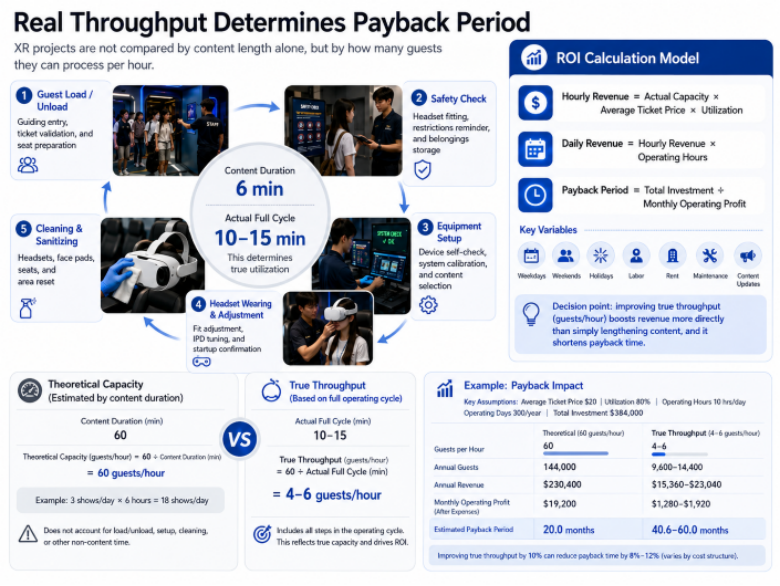
A common mistake is to multiply session length by ticket price and assume the machine runs at full capacity. Real operation is slower. A 6-minute show may require 10-15 minutes per cycle after loading, safety checks, headset adjustment, cleaning, and exit flow. A free roam VR arena may have downtime between groups while staff explain rules and reset equipment.
A basic ROI model should calculate:
- Players or seats per session.
- Real operating cycle, not only content duration.
- Paid sessions per hour.
- Average ticket price.
- Utilization rate for weekdays, weekends, holidays, and low seasons.
- Staff cost per shift.
- Rent or revenue-share structure.
For cultural tourism projects, holiday peaks can be strong, but low-season traffic may decide the payback period. For shopping malls, evenings and weekends matter more than total mall foot traffic.
Product Choice Changes ROI Logic
XR Infinite Space
XR Infinite Space and Free Roam VR formats usually rely on group play, repeat visits, and content updates. They can work well in shopping malls, FECs, and tourist commercial blocks where young customers and families can see the attraction from outside. MiXR’s XR Infinite Space is relevant when the buyer wants a multiplayer XR experience with equipment, content, installation, and operation support in one package.
Flying Theater
Flying Theater is stronger as a destination attraction. It can package a city, scenic region, fantasy world, or cultural story into a high-impact ride. ROI depends on seat count, ticket price, location traffic, and the ability to market it as a must-try experience.
Hyper XR Theater and Glass Theater
Hyper XR Theater and Glass Theater can serve scenic areas, commercial complexes, and event-driven cultural tourism projects. They fit buyers who want a more visible immersive experience than a headset room.
Dark Ride
Dark Ride projects usually need larger investment and longer planning. They are suitable for theme parks or large indoor entertainment centers with stable traffic. A buyer should not choose Dark Ride only because it looks impressive in a proposal. The site must support route planning, safety, maintenance, and scene renewal.
A Practical ROI Formula
Use this simple model before requesting detailed quotations:
- Hourly revenue = real hourly capacity x average ticket price x expected utilization.
- Daily gross revenue = hourly revenue x operating hours.
- Monthly gross revenue = weekday revenue + weekend revenue + holiday revenue.
- Operating profit = gross revenue – staff – rent – utilities – maintenance – marketing – platform or license fees.
- Payback period = total project investment / monthly operating profit.
Do not use one utilization rate for the whole year. Split the model into weekday, weekend, holiday, and low-season periods. A more conservative model may look less exciting, but it prevents poor decisions.
Experience Reminder From Real Projects
The best ROI lever is often not ticket price. It is reducing friction. Clear signage, fast payment, trained staff, visible previews, clean equipment, and a simple safety briefing can improve conversion more than a small discount campaign.
I have seen projects where the attraction was technically strong, but visitors walked away because they did not understand the experience from the storefront. The operator blamed the product. The real problem was poor retail communication.
When ROI Will Be Weak
XR entertainment ROI is likely to be weak when the project has low visibility, unstable traffic, no marketing plan, long reset time, too much staff dependence, or content that local customers will only try once. It is also weak when the buyer chooses a format that does not match the venue. A museum should not be forced into a combat arena concept. A youth mall should not buy a slow educational exhibit and expect party traffic.
The safer path is to match the attraction to the business model first. Product selection, cost, and ROI should then support that decision, not decorate it.